- Determine vapor-liquid equilibria of a molecular model using the Gibbs ensemble technique (Panagiotopoulos) or the NpT+ test particle technique (Fischer).
- Performing simulations in non-cubic simulation boxes with fluctuating shape (Rahman and Parrinello). This is quite important for simulating solids.
- Free energy calculations of the solid phase (Frenkel and Ladd).
- Fluid-solid coexistence lines with the Gibbs-Duhen integration technique (Kofke).
In the last years we have used these techniques to determine the phase diagram of a number of molecular models. Just to mention a few examples:
- Hard diatomic molecules (hard dumbbells). This work was made with Peter Monson (USA).
- The phase diagram of the Gay Berne model (this work was made in collaboration with Enrique de Miguel (Huelva, Spain).
- Two center Lennard-Jones molecules (in collaboration with
F.J.Blas, E.de Miguel and A.G.Galindo) :
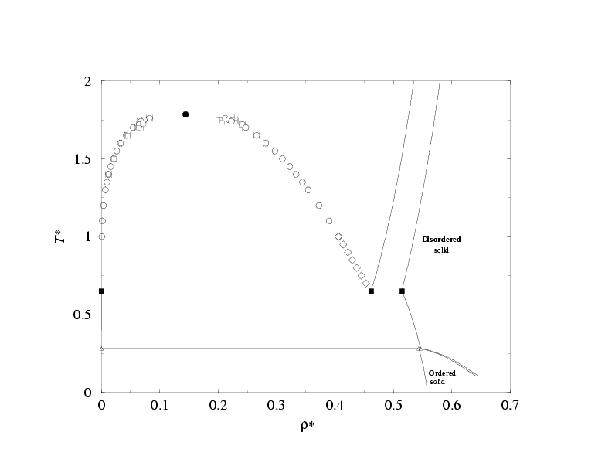
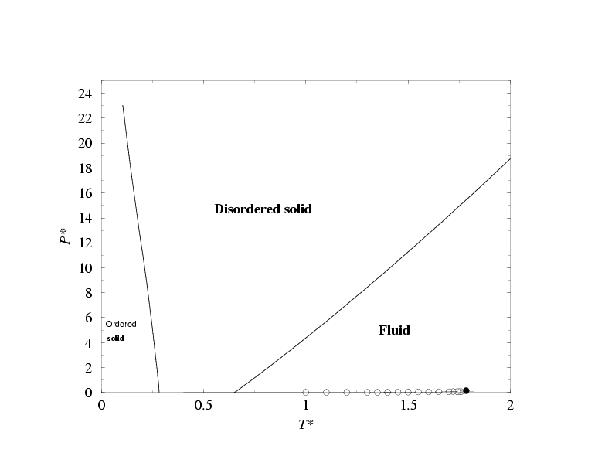
- Phase diagram of the two center Lennard-Jones model. Results are presented in the T-density and in the p-T plane. Two types of solid are found. One with ordering of bonds and the other one with disorder of bonds. In both cases the atoms form a fcc like close packing structure.
Taken from C.Vega, C.McBride, F.J.Blas, E.de Miguel and A.Galindo, J.Chem.Phys.,118, 10696, (2003).
- Simple model of electrolites , the Restricted Primitive Model (in collaboration with J.L.F.Abascal, Madrid and F.Bresme, Imperial College, London) .
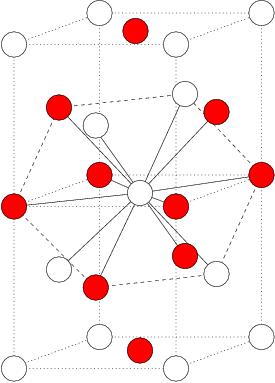
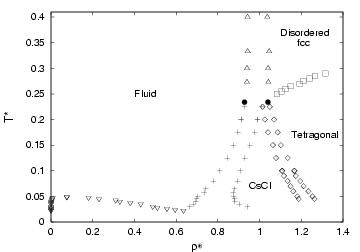
- Phase diagram of the RPM (restricted primitive model). The restricted primitive model is formed by cations and anions of the same size and charge (opposite sign) Taken from
C.Vega, C.McBride, F.Bresme, J.L.F.Abascal, J.Chem.Phys., July, (2003). - Phase diagram of the two center Lennard-Jones model. Results are presented in the T-density and in the p-T plane. Two types of solid are found. One with ordering of bonds and the other one with disorder of bonds. In both cases the atoms form a fcc like close packing structure.